
2023 is over, and it’s time for a full recap on the real estate market in UAE during this year. The Market Watch full annual report is here, which is your optimum source of trusted data and insights about the real estate market in UAE.
Let’s go into more detail about the market performance during 2023, the high-in-demand areas in Dubai and Abu Dhabi, and more.

Highlights
- The UAE economy grew by 3.7% during the first half of 2023, while the non-oil sector increased by 5.9% during the same period, according to Reuters.
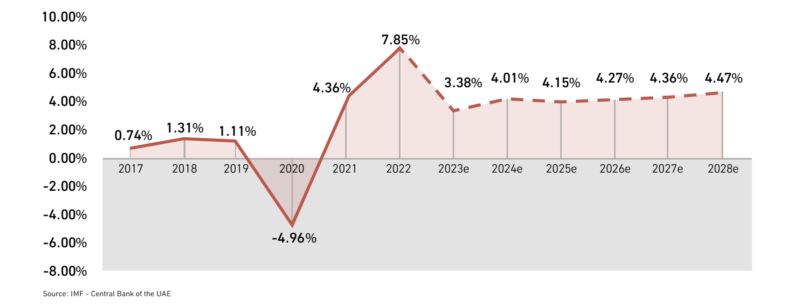
- Accordingly, in 2023, the UAE’s economy is expected to rise by 3.38%, which is low compared to 2022 with growth of 7.85%. This is due to the slowdown in the performance of the non-oil sector, which constitutes around 75% of the country’s economy.
- These economic changes match the predictions of the Central Bank of the United Arab Emirates (CBUAE).
They indicate that the economy will witness an average increase of 4.25% during the upcoming 5 years, with a total amount of AED 2067.1 Billion in 2028.
Abu Dhabi
Highlights
- During 2023, Abu Dhabi’s economy had a good performance, supported by the growth in the non-oil sector. This sector grew by around 6% during the first half of YoY.
- The manufacturing sector share was more than 8% of Abu Dhabi’s GDP, which grew during Q1 by 5.6% and Q2 by 12.4%.
- In Abu Dhabi, the real estate activities and construction sectors grew by around 13.4% YoY during the first half of 2023, which represents 12% of the total GDP.
- The construction sector is considered the main contributor to the sectors’ growth, with 17% in the first half, contributing to around 8.5% of the total GDP.
- On the other hand, the real estate activities sector rose by 5.7% compared to 2022’s first half.
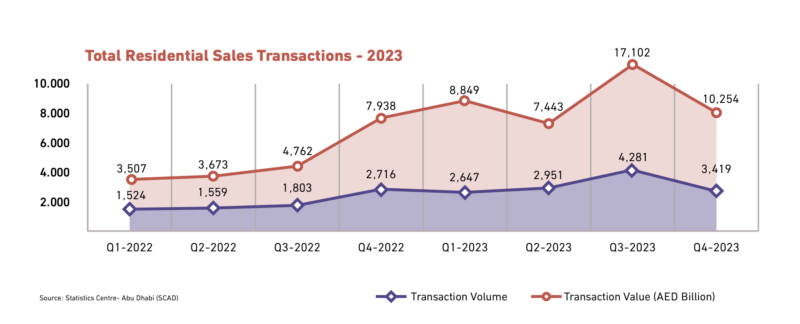
Total Sales Transactions 2023
Abu Dhabi witnessed a significant increase in the total sales transitions: residential and commercial, during 2023, according to the Department of Municipalities and Transport’s (DMT) data.
- The number of transactions reached a high record for a year, achieving 13,298, compared to 7,602 transactions in 2022. This reflects a 75% increase.
- For residential transactions, it has a share of 97% of the total volume and around 85% of the overall value.
- The transaction value reached an amount of AED 44 Billion, showing a notable 120% increase compared to AED 19.9 Billion in 2022.
The increase in transactions reflects the investor’s confidence and trust in Abu Dhabi’s real estate market. This growth also owes to the government’s work in improving the investment environment and regulations, making it a more attractive place to invest.
Off-plan Sales Transactions 2023
The off-plan market continued its support of the real estate market in Abu Dhabi during 2023.
- During 2023, off-plan sales transactions reached 10,151, while in 2022, it was 5,095. This represents 76% of the total transactions compared to 67% of the total transactions in 2022.
- This shows a high year-on-year increase of 99% in volume and a 174% increase in value.
- In 2023, The value of the off-plan sales transactions reached AED 35,570 Billion, contributing to 81% of the total sales transactions value.
- This represents a 174% increase compared to 2022 in which its total sales transactions value was AED 12,989 Billion, which contributed to 65% of the total value.
Existing/Ready Sales Transactions 2023
- In 2023, the existing/ready market registered 3,147 transactions which represents around 24% of the total transactions, compared to 2507 transactions in 2022 which represented 26% of the total transactions in 2022.
This reflects a growth of 26% when compared to 2022.
- For the quarter-on-quarter performance, Q4 showed a growth of 2% compared to 831 transactions in Q3 2023.
- The existing/ready transactions value in 2023 reached AED 8,078 billion. This contributed to 19% of the total sales transactions value compared to 35% in 2022.
- This sector also witnessed a recognizable increase in terms of the value of 17% compared to AED 6,890 Billion in 2022.
High-in-Demand Areas for Sale and Rent
| Apartments for Sale | Villas for Sale | Apartments for Rent | Villas for Rent |
| Al Reem Island | Yas Island | Al Reem Island | Khalifa City |
| Yas Island | Saadiyat Island | Al Raha Beach | Mohamed Bin Zayed City |
| Al Raha Beach | Al Reef | Khalifa City | Yas Island |
| Saadiyat Island | Al Reem Island | Corniche Road | Al Reef |
| Masdar City | Khalifa City | Al Khalidiya | Al Saadiyat Island |
Property Sales Prices in Abu Dhabi
The table below shows the average asking prices for apartments in Abu Dhabi in 2023:
| Three Bedrooms | Two Bedrooms | One Bedroom | Area |
| AED 2,085,000 | AED 1,400,000 | AED 850,000 | Al Reem Island |
| AED 1,900,000 | AED 1,700,000 | AED 950,000 | Yas Island |
| AED 2,500,000 | AED 1,745,000 | AED 1,200,000 | Al Raha Beach |
| AED 7,500,000 | AED 4,471,000 | AED 2,200,000 | Saadiyat Island |
| N/A | AED 1,100,000 | AED 750,000 | Masdar City |
The table below shows the average asking prices for villas in Abu Dhabi in 2023:
| Five Bedrooms | Four Bedrooms | Three Bedrooms | Area |
| AED 6,800,000 | AED 6,000,000 | AED 4,500,000 | Yas Island |
| AED 17,732,000 | AED 9,000,000 | AED 8,000,000 | Saadiyat Island |
| AED 2,826,000 | AED 2,219,000 | AED 1,600,000 | Al Reef |
| N/A | AED 3,359,000 | AED 3,450,000 | Al Reem Island |
| AED 6,031,000 | AED 3,895,000 | AED 2,580,000 | Khalifa City |
Property Rental Prices in Abu Dhabi
The table below shows the average rental prices for apartments in Abu Dhabi in 2023:
| Three Bedrooms | Two Bedrooms | One Bedroom | Area |
| AED 128,000 | AED 88,000 | AED 60,000 | Al Reem Island |
| AED 164,000 | AED 107,000 | AED 64,000 | Al Raha Beach |
| AED 90,000 | AED 64,000 | AED 42,000 | Khalifa City |
| AED 155,000 | AED 115,000 | AED 87,000 | Corniche Road |
| AED 100,000 | AED 77,000 | AED 60,000 | Al Khalidiya |
The table below shows the average rental prices for villas in Abu Dhabi in 2023:
| Five Bedrooms | Four Bedrooms | Three Bedroom | Area |
| AED 170,000 | AED 160,000 | AED 140,000 | Khalifa City |
| AED 150,000 | AED 134,000 | AED 110,000 | Mohamed Bin Zayed City |
| AED 320,000 | AED 320,000 | AED 250,000 | Yas Island |
| AED 163,000 | AED 141,000 | AED 100,000 | Al Reef |
| AED 600,000 | AED 430,000 | AED 300,000 | Saadiyat Island |
Dubai
Highlights
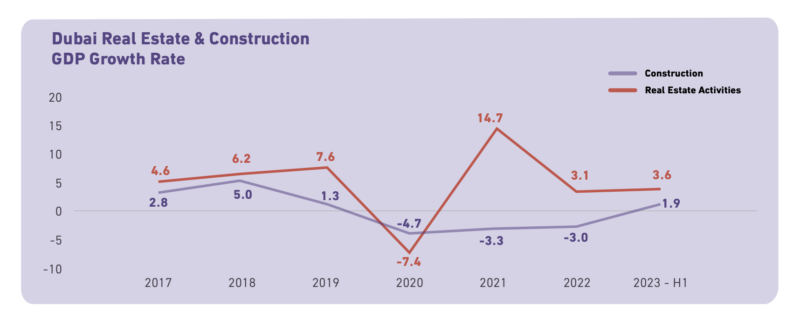
- The construction and real estate sectors started recovering from the decline in 2020 due to the covid. Their decline rates were 4.7% and 7.4% respectively.
- Fortunately, the real estate sectors started recovering early the following year, while the construction sector showed more improvement during the beginning of 2023.
- The real estate and construction sectors in Dubai witnessed a growth of 3.6% and 1.9%, respectively, during the 1st half of 2023, according to Dubai Statistics Center data.
- Both sectors account for almost 14.4% of Dubai’s total GDP in 2023.
Volume
Total Sales Transactions Volume
- In 2023, the registered sales transactions reached 133,134, which is a significant increase compared to 96,459 in 2022.
- This records an increase of 38%, showing the highest performance for a year ever recorded, owing to the amazing performance of the off-plan transactions.
- During 2023, 178 areas in Dubai witnessed real estate transactions. 55.2% of the transactions took place in 10 areas where Al Barsha South Fourth is at the top of the list. It contributed 10.7% to the total sales transactions.
Off-plan Sales Transactions
- The off-plan sales witnessed a high record by reaching 68,783 transactions in 2023 compared to 43,151 in 2022, which shows a 59.4% increase.
This is the highest performance for a year ever recorded in the off-plan market.
- 45 areas in 2023 saw off-plan transactions in Dubai, with 70.4% of the total transactions taking place in 10 areas.
- Al Barsha South Fourth takes the lead among those 10 areas, contributing to 14.4% of the total transactions.
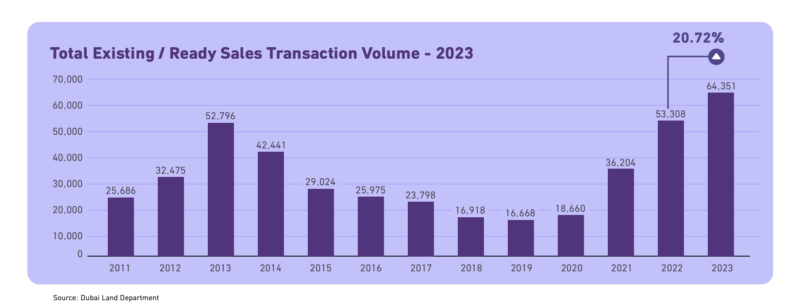
Existing/Ready Sales Transactions
- In 2023, the existing sales made a new record, reaching 64,351 transactions, compared to 53,308 transactions in 2022.
- The ready/existing transactions witnessed a year-on-year increase of 20.72% compared to 2022.
- The existing/ready transactions took place in 178 areas in Dubai, with 51.2% of the total transactions accounting for 10 areas.
- Among those areas, Business Bay had the highest contribution, which is 7.7% of the total transactions.
Value
Total Sales Transactions Value
- In 2023, sales transactions recorded the highest value ever for a year, reaching AED 411.74 Billion compared to AED 264.34 Billion in 2022.
- The market value of sales transactions increased by 56% compared to 2022, forming a new record for the total sales value.
Off-plan Sales Transactions
- A notable record was achieved by the off-plan sales reaching a value of AED 160.46 billion in 2023, while in 2022, the value was AED 93 Billion, achieving a 72.3% increase.
- The off-plan transactions contributed to 39% of the total transaction value, witnessing the highest value ever recorded in the off-plan market.
- The off-plan transactions took place in 54 areas, with 65.87% of the total transaction value being accounted for by 10 areas. Marsa Dubai comes at the top of the list as it contributed 16% of the total transaction value.
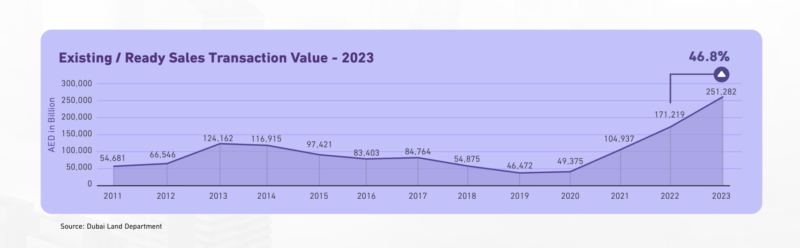
Existing/Ready Sales Transactions
- The existing/ready sales value hit records in 2023 with a value of AED 251.3 Billion, compared to AED 171.2 Billion in 2022.
- This reflects a significant increase of 46.76%, registering the highest transaction value ever in a year.
Total Rental Contracts 2023
Dubai has a relatively stable rental market compared to global markets. Let’s dig into more details below.
- In 2023, the rental contracts witnessed a year-on-year increase of 4.17%, as the number of contracts was 789,015 compared to 757,423 contracts in 2022.
- During this year, the change in the tenants’ behaviour was noticeable as they preferred to buy a home instead of renting it. This is due to the increase in the average market value for renting.
- In 2023, around 47.9%% of the total rental contracts were new contracts, while 52.1%% were renewals, according to Dubai Land Department (DLD)data.
- The annual contracts had a share of 91.72 % of the total contracts, while its contribution in 2022 was 84.33%.
- For the non-annual contracts, it decreased by 6.87%, representing 8.28% of the total contracts.
- 68.33% of the total contracts were residential contracts and 30.47% were commercial.
Top 10 Areas for Total Rental Contracts
- Al Warsan First
- Jabal Ali First
- Business Bay
- Al Mararr
- Al Barsha South Fourth
- Naif
- Marsa Dubai
- Nadd Hessa
- Al Karama
- Hor Al Anz
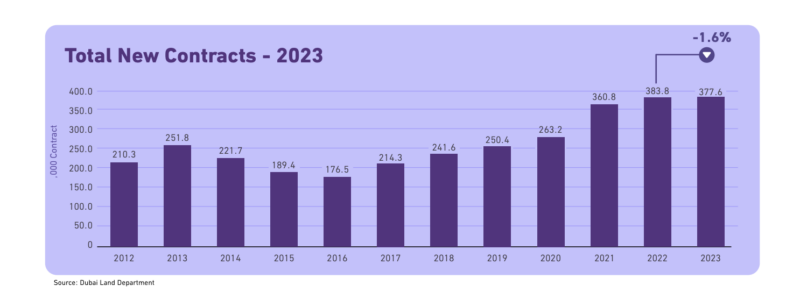
New Rental Contracts Volume 2023
In 2023, new contracts witnessed a slight decrease registering 377,604 transactions compared to 383,777 contracts in 2022. A total of 206 areas saw new rental contracts during
Top 10 Areas for Volume of New Contracts
- Jabal
- Al Mararr
- Hor Al Anz
- Al Warsan First
- Business Bay
- Al Barsha South Fourth
- Naif
- Marsa Dubai
- Jabal Ali First
- Portsaeed
Renewed Contracts Volume Q3 2023
- The renewed contracts supported the rental market by registering 411,411 transactions, with an increase of 10% compared to 273,646 contracts in 2022.
- A total of 204 areas saw renewed contracts in 2023, with 28.1% of the total renewed contracts being accounted for by just 10 areas.
Top 10 Areas for Volume of Renewed Contracts
- Jabal Ali First
- Al Warsan First
- Nadd Hessa
- Al Karama
- Al Barsha First
- Al Nahda Second
- Business Bay
- Marsa Dubai
- Naif
- Al Barsha South Fourth
- Al Goze Industrial Second
High-in-Demand Areas for Sale and Rent
The following table includes the top options for owning or renting an apartment or villa in Dubai.
| Apartments for Sale | Villas for Sale | Apartments for Rent | Villas for Rent |
| Dubai Marina | Dubai Hills Estate | Dubai Marina | Dubai Hills Estate |
| Downtown Dubai | Palm Jumeirah | Jumeirah Village Circle | Damac Hills 2 |
| Jumeirah Village Circle | Arabian Ranches | Downtown Dubai | Al Barsha |
| Business Bay | Damac Hills | Business Bay | Jumeirah |
| Palm Jumeirah | Mohamed Bin Rashed City | Jumeirah Lake Towers | Damac Hills |
Property Sales Prices in Dubai
The table below shows the average asking prices for apartments in Dubai in 2023:
| Three Bedrooms | Two Bedrooms | One Bedroom | Area |
| AED 3,800,000 | AED 2,400,000 | AED 1,450,000 | Dubai Marina |
| AED 6,000,000 | AED 4,100,000 | AED 1,900,000 | Downtown Dubai |
| AED 2,031,000 | AED 1,500,000 | AED 850,000 | Jumeirah Village Circle |
| AED 3,600,000 | AED 2,500,000 | AED 1,550,000 | Business Bay |
| AED 7,000,000 | AED 4,950,000 | AED 2,900,000 | Palm Jumeirah |
The table below shows the average asking prices for villas in Dubai in 2023:
| Area | Three Bedrooms | Four Bedrooms | Five Bedrooms |
| Dubai Hills Estate | AED 5,600,000 | AED 6,100,000 | AED 9,575,000 |
| Palm Jumeirah | AED 13,603,000 | AED 30,000,000 | AED 36,450,000 |
| Arabian Ranches | AED 3,775,000 | AED 6,500,000 | AED 8,950,000 |
| Damac Hills | AED 2,900,000 | AED 4,036,000 | AED 7,150,000 |
| Mohamed Bin Rashed City | AED 3,400,000 | N/A | AED 21,000,000 |
Property Rental Prices in Dubai
The table below shows the average rental prices for apartments in Dubai in 2023:
| Area | One Bedroom | Two Bedrooms | Three Bedrooms |
| Dubai Marina | AED 110,000 | AED 160,000 | AED 250,000 |
| Jumeirah Village Circle | AED 68,750 | AED 95,000 | AED 138,000 |
| Downtown Dubai | AED 130,000 | AED 255,000 | AED 360,000 |
| Business Bay | AED 95,000 | AED 145,000 | AED 220,000 |
| Jumeirah Lake Towers | AED 80,000 | AED 115,000 | AED 160,000 |
The table below shows the average rental prices for villas in Dubai in 2023:
| Area | Three Bedrooms | Four Bedrooms | Five Bedrooms |
| Dubai Hills Estate | AED 330,000 | AED 342,000 | AED 488,000 |
| Damac Hills 2 | AED 85,000 | AED 103,000 | AED 130,000 |
| Al Barsha | AED 306,000 | AED 350,000 | AED 400,000 |
| Jumeirah | AED 270,000 | AED 400,000 | AED 450,000 |
| Damac Hills | AED 210,000 | AED 322,500 | AED 420,000 |
With a closer look into the market during 2023, you can always go forward with data-driven decisions either for investing or finding a new home. You can dig into more details and insights by downloading the Market Watch full annual report for 2023. Just click below.


