
With the end of Q1 2024, it’s time to have a look at how the real estate market performed through the Market Watch report.
Its full version is just out; it includes the top highlights and insights of the Abu Dhabi and Dubai markets to help you have a quick yet data-based vision over the last period; let’s get into more details!
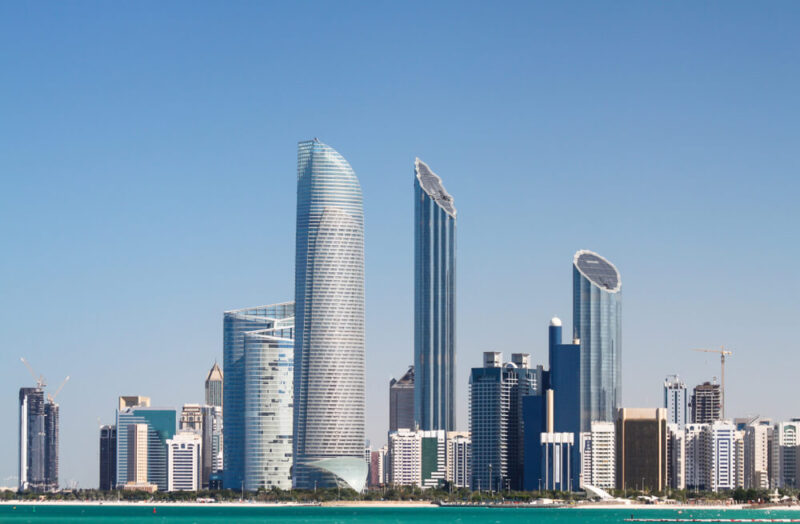
Abu Dhabi
Highlights
- Abu Dhabi’s economy had a positive performance during 2024 due to the significant growth of the non-oil sector, which expanded by 9.1% in 2023.
Accordingly, the capital’s real estate activities and construction sectors grew by more than 11.6% YoY in 2023, contributing to around 12% of the total GDP. - The construction sector was the main driver of this growth, increasing by around 14% and accounting for 8.6% of the GDP.
Market Performance
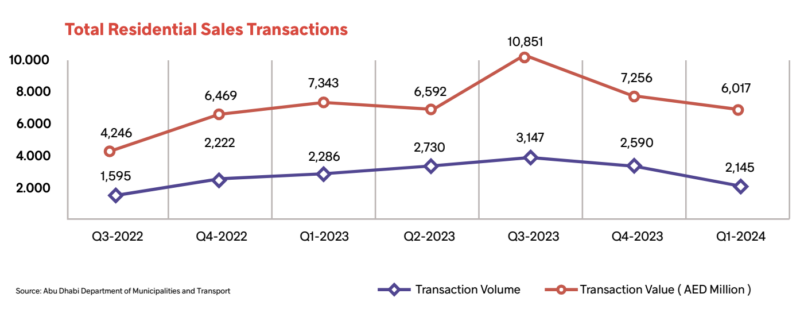
Total Sales Transactions
- According to the Department of Municipalities and Transport’s (DMT) data, during Q1 2024, the UAE’s capital witnessed a decrease in the total sales transactions in both residential and commercial types.
- The total number of transactions reached 2,145.
- During this period, the residential transactions reached 78% of the total volume and around 64% of the total value.
- Regarding the transaction value, it amounted to AED 6.02 Billion, while in Q1 2023, it reached AED 7.34 Billion, showing an 18% decrease.
- In 2023, the real estate market witnessed a notable jump in transactions, with a 75% increase, while sales value rose by 120% in the same period. This indicates a further increase in the prices.
- Although the slowdown in Q1 2024, the market is expected to recover rapidly and reach a high performance; these expectations are supported by
- The governmental support
- The country’s strategic focus on economic diversification, with the real estate sector playing a crucial role
- Increased foreign demand due to regional conflicts
- The recovery of the tourism sector.
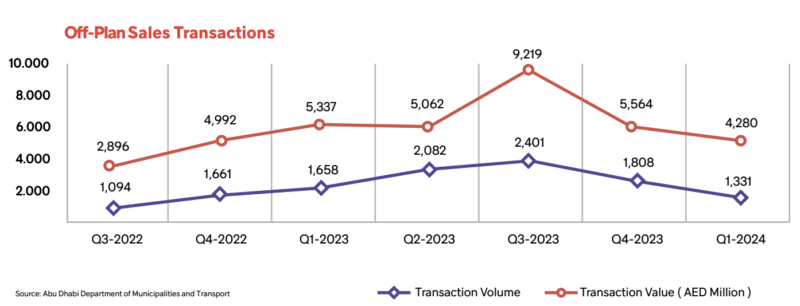
Off-plan Sales Transactions
Volume
- During Q1 2024, the off-plan market registered around 1,331 residential off-plan sales transactions compared to 1,658 transactions in Q1 2023.
This represents 62% of the total transactions compared to 73% in Q1 2023, recording a high YoY volume decrease of 20%.
Value
- The off-plan sales transaction value in Q1 2024 accounted for AED 4.28 Billion, 71% of the total sales transaction value.
This year, it showed a significant decline of 20% compared to Q1 2023.
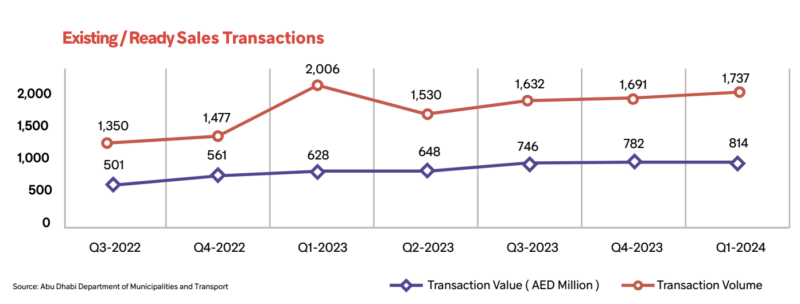
Existing/Ready Sales Transactions
- The existing/ready market registered 814 transactions in Q1 2024, representing about 38% of the total transactions. In Q1 2023, the total transactions reached 628, contributing to 27% of the total transactions in this period.
This reflects a notable increase of 30% from Q1 2023. - The value of the existing/ready market transaction amounted to AED 1.74 Billion, representing 29% of the total sales transactions value, while in Q1 2023, it reached 27%.
Moreover, it witnessed a decline of 13.4% compared to AED 2 Billion in Q1 2023.
High-in-Demand Areas for Sale and Rent
| Apartments for Sale | Villas for Sale | Apartments for Rent | Villas for Rent |
| Al Raha Beach | Al Reef | Al Khalidiya | Al Reef |
| Al Reem Island | Al Reem Island | Al Raha Beach | Khalifa City |
| Masdar City | Khalifa City | Al Reem Island | Mohamed Bin Zayed City |
| Saadiyat Island | Saadiyat Island | Corniche Road | Saadiyat Island |
| Yas Island | Yas Island | Khalifa City | Yas Island |
Property Sales Prices in Abu Dhabi
The table below shows the average asking prices for apartments in Abu Dhabi in Q1 2024:
| Area | One Bedroom | Two Bedrooms | Three Bedrooms |
| Al Raha Beach | AED 1,200,000 | AED 1,800,000 | AED 2,600,000 |
| Al Reem Island | AED 875,000 | AED 1,500,000 | AED 2,120,000 |
| Masdar City | AED 641,000 | AED 978,000 | AED 1,700,000 |
| Saadiyat Island | AED 2,400,000 | AED 4,728,000 | AED 9,020,000 |
| Yas Island | AED 1,100,000 | AED 1,820,000 | AED 2,400,000 |
The table below shows the average asking prices for villas in Abu Dhabi in Q1 2024:
| Area | Three Bedrooms | Four Bedrooms | Five Bedrooms |
| Al Reef | AED 1,603,000 | AED 2,242,500 | AED 2,500,000 |
| Al Reem Island | AED 3,900,000 | AED 4,520,000 | AED 7,119,000 |
| Khalifa City | AED 2,677,000 | AED 4,200,000 | AED 6,154,000 |
| Saadiyat Island | AED 9,900,000 | AED 12,500,000 | AED 18,733,000 |
| Yas Island | AED 4,300,000 | AED 6,100,000 | AED 7,615,000 |
Property Rental Prices in Abu Dhabi
The table below shows the average rental prices for apartments in Abu Dhabi in Q1 2024.
| Area | One Bedroom | Two Bedrooms | Three Bedrooms |
| Al Khalidiya | AED 64,500 | AED 87,000 | AED 100,000 |
| Al Raha Beach | AED 73,500 | AED 110,000 | AED 140,000 |
| Al Reem Island | AED 65,000 | AED 95,000 | AED 135,000 |
| Corniche Road | AED 90,000 | AED 125,000 | AED 160,000 |
| Khalifa City | AED 45,000 | AED 70,000 | AED 105,000 |
The table below shows the average rental prices for villas in Abu Dhabi in Q1 2024:
| Area | Three Bedroom | Four Bedrooms | Five Bedrooms |
| Al Reef | AED 105,000 | AED 135,000 | AED 150,000 |
| Khalifa City | AED 135,000 | AED 179,000 | AED 205,000 |
| Mohamed Bin Zayed City | AED 112,000 | AED 131,000 | AED 152,000 |
| Saadiyat Island | AED 415,000 | AED 450,000 | AED 747,000 |
| Yas Island | AED 225,000 | AED 300,000 | AED 378,000 |
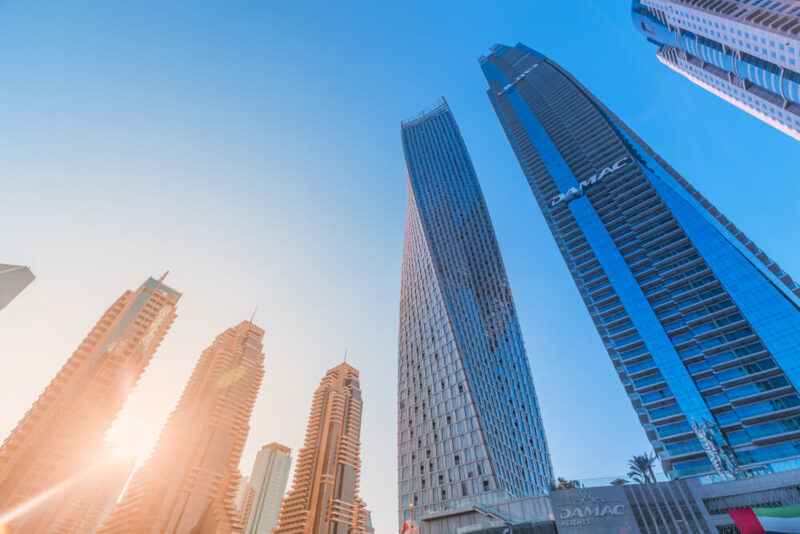
Dubai
Highlights
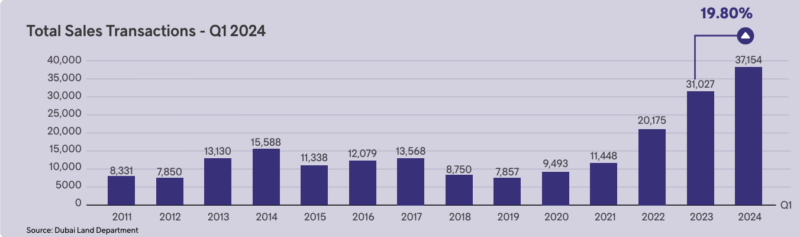
- Dubai’s real estate market witnessed a YoY surge of 20% in the number of sales transactions during Q1 2024. Its number reached 37,154 transactions compared to 31,027 in Q1 2023.
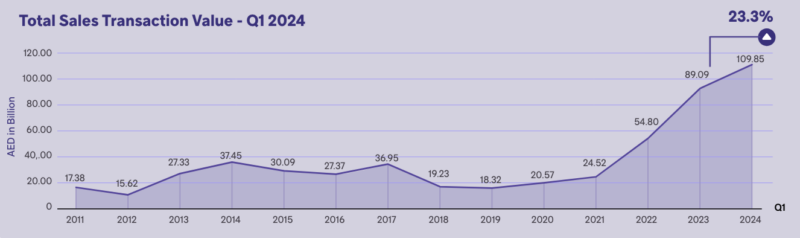
- The value of the sales transactions showed a notable increase, reaching almost AED 109.85 billion, reflecting a 23.3 % YoY growth.
- For the existing property transactions, it reached a YoY increase of about 10.38 % in volume and 21.8% in value.
- During Q1 2024, the off-plan market witnessed more demand, with a YoY increase of around 28.6 % in volume and 25.6 % in value.
Market Performance
Total Sales Transactions Volume
- According to DLD’s data, Dubai witnessed a notable increase in total sales transactions during Q1 2024.
- It recorded 37,154 registered transactions; compared to Q1 2023, it witnessed 31,027 transactions, which is a substantial increase of 20% and the highest performance for a quarter ever recorded.
This is driven by the outstanding performance of the off-plan transactions. - In Q1 2024, the existing/ready transactions contributed to 44.65% of the total sales transactions compared to 48.44% in Q1 2023.
- The off-plan transactions contributed to 55.35% of the total sales transactions compared to 51.56% in Q1 2023.
Off-plan Sales Transactions Volume
- In Q1 2024, the off-plan sales transactions reached 20,565 compared to 15,998 transactions in Q1 2023, recording a 28.6% increase to be the highest performance for a quarter ever in the off-plan market.
Existing/Ready Sales Transactions Volume
- In Q1 2024, the existing sales transactions had a new record by reaching 16,589 transactions, which shows a YoY increase of 10.4% compared to 15,029 in Q1 2023.
With such an increase, it records the highest performance for Q1 ever recorded.
Total Sales Transactions Value
- During the first quarter of 2024, the sales transactions reached the second-highest value ever for a quarter and the best performance for Q1 for the last decade; it reached AED 109.85 billion, compared to AED 89.09 billion in Q1 2023, showing a YoY increase by 23.3%.
- The strong economic growth and tourism industry led to a steady demand for housing.
Off-plan Sales Transactions Value
- The off-plan sales made a record by reaching a value of 44.6 billion in Q1 2024, compared to AED 35.5 billion in Q1 2023, achieving about a 25.6% increase.
- During Q1 2024, the off-plan transactions contributed 40.6% of the total transaction value, representing the second-highest value ever recorded in the off-plan market.
Existing/Ready Sales Transactions Value
- In Q1 2024, the existing/ready sales value hit a record high of AED 65.3 Billion compared to AED 53.6 Billion in Q1 2023. This marks a significant increase of 21.8% and records the second-highest transaction value ever in the last decade.
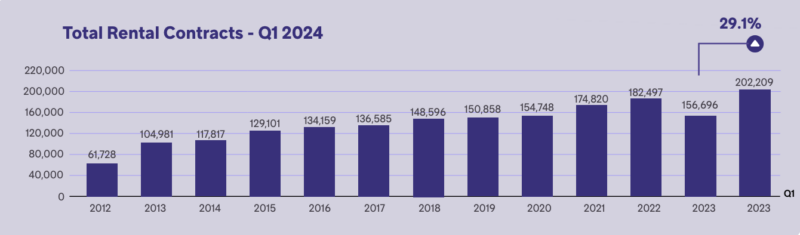
Total Rental Contracts
- The rental contracts during the first quarter of 2024 witnessed a YoY increase of 29.1%.
This is through registering 202,209 contracts compared to 156,696 contracts in Q1 2023, recording a new hit as the highest performance for a quarter ever recorded. - According to the Dubai Land Department (DLD), in Q1 2024, around 50.8% of the total rental contracts were new and 49.2% were renewals.
- 93.9% of the total contracts were annual; in Q1 2023, they represented 90.9%
- The non-annual contracts decreased by 3%, representing 6.1% of the total contracts.
- In Q1 2024, the residential contracts’ share was around 61.9% of the total rental contracts, while 37.2% were registered for commercial purposes and others.
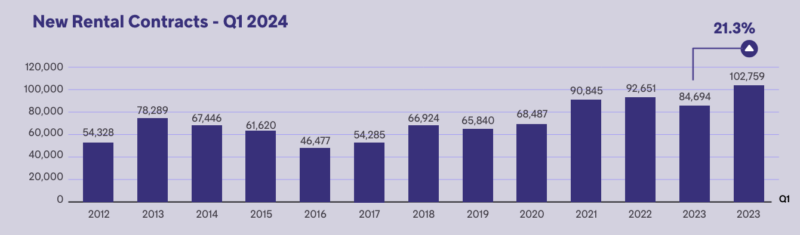
New Rental Contracts
- The new contracts witnessed a significant increase of 21.3% in Q1 2024; it registered 102,759 transactions compared to 84,694 contracts in Q1 2023, hitting a record of the best performance for a quarter ever.
- Its contribution to the total contracts decreased by around 3%, reaching 50.8%, while its contribution to the total contracts in Q1 2023 was 54.1%.
Top 10 Areas of New Rental Contracts Q1 2024
- Jabal Ali Industrial First
- Muhaisanah Second
- Al Mararr
- Port Saeed
- Al Warsan First
- Business Bay
- Al Goze Third
- Al Muteena
- Al Khabeesi
- Al Barsha South Fourth
Renewed Rental Contracts
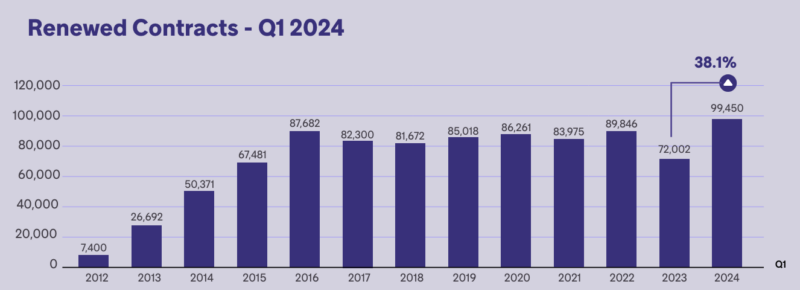
The renewed contracts supported the rental market by registering 99,450 transactions, representing a notable increase of 38.1% compared to 72,002 contracts in Q1 2023, which recorded the highest performance for a quarter ever.
Top 10 Areas of Renewed Contracts Q1 2024
- Al Warsan First
- Jabal Ali First
- Al Karama
- Naif
- Nadd Hessa
- Al Nahda Second
- Al Suq Al Kabeer
- Al Goze Industrial Second
- Business Bay
- Al Murqabat
High-in-Demand Areas for Sale and Rent
The following table includes the top options for owning or renting an apartment or villa in Dubai.
| Apartments for Sale | Villas for Sale | Apartments for Rent | Villas for Rent |
| Business Bay | Al Furjan | Business Bay | Al Barsha |
| Downtown Dubai | Arabian Ranches | Deira | Damac Hills 2 |
| Dubai Marina | Dubai Hills Estate | Downtown Dubai | Dubai Hills Estate |
| Jumeirah Village Circle | Mohammed Bin Rashid City | Dubai Marina | Dubai Land |
| Palm Jumeirah | Palm Jumeirah | Jumeirah Village Circle | Jumeirah |
Property Sales Prices in Dubai
The table below shows the average asking prices for apartments in Dubai in Q1 2024:
| Area | One Bedroom | Two Bedrooms | Three Bedrooms |
| Business Bay | AED 1,700,000 | AED 2,750,000 | AED 4,000,000 |
| Downtown Dubai | AED 2,093,000 | AED 4,600,000 | AED 7,700,000 |
| Dubai Marina | AED 1,620,000 | AED 2,700,000 | AED 4,100,000 |
| Jumeirah Village Circle | AED 967,000 | AED 1,491,000 | AED 2,224,000 |
| Palm Jumeirah | AED 3,200,000 | AED 5,000,000 | AED 9,700,000 |
The table below shows the average asking prices for villas in Dubai in Q1 2024:
| Area | Three Bedrooms | Four Bedrooms | Five Bedrooms |
| Al Furjan | AED3,200,000 | AED 4,500,000 | AED 6,900,000 |
| Arabian Ranches | AED 4,200,000 | AED 6,750,000 | AED 11,000,000 |
| Dubai Hills Estate | AED 6,599,000 | AED 7,600,000 | AED 13,000,000 |
| Mohammed Bin Rashid City | AED 3,500,000 | AED 8,900,000 | AED 17,500,000 |
| Palm Jumeirah | AED 14,400,000 | AED 28,650,000 | AED 45,000,000 |
Property Rental Prices in Dubai
The table below shows the average rental prices for apartments in Dubai in Q1 2024:
| Area | One Bedroom | Two Bedrooms | Three Bedrooms |
| Business Bay | AED 105,000 | AED 150,000 | AED 230,000 |
| Deira | AED 55,000 | AED 78,000 | AED 100,000 |
| Downtown Dubai | AED 135,000 | AED 205,000 | AED 353,000 |
| Dubai Marina | AED 110,000 | AED 174,000 | AED 260,000 |
| Jumeirah Village Circle | AED 75,000 | AED 110,000 | AED 143,000 |
The table below shows the average rental prices for villas in Dubai in Q1 2024:
| Area | Three Bedrooms | Four Bedrooms | Five Bedrooms |
| Al Barsha | AED 250,000 | AED 323,000 | AED 450,000 |
| Damac Hills 2 | AED 100,000 | AED 112,500 | AED 140,000 |
| Dubai Hills Estate | AED 328,000 | AED 433,000 | AED 816,000 |
| Dubai Land | AED 155,000 | AED 210,000 | AED 350,000 |
| Jumeirah | AED 308,000 | AED 481,000 | AED 629,000 |
Mo’asher
Sales Price Index
- In Q1 2024, the overall quarterly Index for sales recorded 1.666, and the Index for price was AED 1,505,052.
- The quarterly sales Index recorded
- 1.800 for apartments
- 1.643 for villas/townhouses
- The quarterly Index price, it reached
- AED 1,472,327 for apartments
- AED 2,813,780 for villas/townhouses
Rent Price Index
- In Q1 2024, the overall quarterly Index for sales reached 1.126, and the Index for price reached AED 59,535.
- The quarterly rental Index recorded
- 1.156 for apartments
- 1.013 for villas/townhouses
- The quarterly Index price reached
- AED 55,111 for apartments
- AED 154,332 for villas/townhouses
For more insights and data, click the link below to get the full report


