The real estate market in UAE is a dynamic one, and in order to make the best out of its opportunities, you need always to have a closer eye on it.
This inclusive and insightful guide will assist you in this; it will walk you through the insights and performance of the UAE real estate sector during Q3 2023, according to the latest Market Watch report.
The report brings you all the information you need for data-driven decisions and a deep overview.

Highlights
Find below the market’s highlights during the third quarter of 2023.
- During the first 3 months of 2023, the UAE’s economic growth witnessed a 3.8% decrease YoY and a 5.5% decrease compared to the last quarter of 2022.
- Although there was a recognized dip in oil production growth, it aligns with the Central Bank of the United Arab Emirates’ predictions.
- 2024 is likely to witness an increase in oil production as some restrictions will be eased.
Abu Dhabi
Highlights
- Abu Dhabi, over the last period, managed to solidify its international standing successfully and sustained its competitive advantage while developing a stable macroeconomic environment.
- In Abu Dhabi, the real estate activities and construction sectors during Q2 2023 witnessed around a 15.5% increase compared to the same period last year and 7.5% compared to Q1 2023.
- The construction sector was one of the main reasons, as it witnessed a big increase of 19.1% compared to Q2 2022 and 8.1% compared to Q1 2023.
- On the other hand, the real estate activities sector showed an increase of 7.2% and 6% compared to Q2 2022 and Q1 2023, respectively.
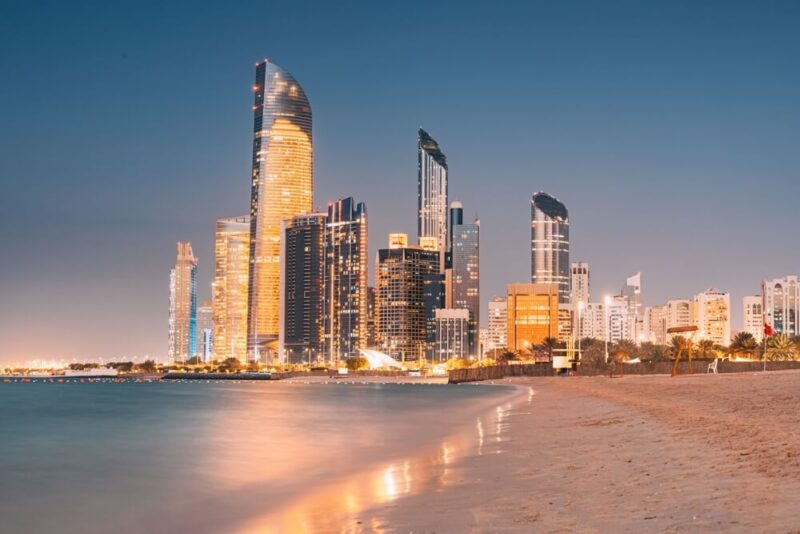
Total Sales Transactions
- During Q3 2023, Abu Dhabi showed a significant increase in total sales transitions, including residential and commercial, according to data from the Department of Municipalities and Transport (DMT).
- The number of transactions shows a high record for a quarter, reaching 3,718 transactions. Compared to Q2 2022, with 1,569 transactions, it indicates a significant rise of 137%.
- During this quarter, 92% of the total volume and 90% of the overall value were for the residential transitions.
- The growth in the number of transactions reflects the investors’ confidence in Abu Dhabi’s real estate market. In addition, the government’s continuous efforts in improving and developing the investment environment and regulatory framework made it a promising atmosphere for investment.
Off-plan Sales Transactions
- Q3 2023 was no exception in the off-plan market support for the real estate market in Abu Dhabi.
- The off-plan sales transactions during Q3 2023 were 2,954, compared to 1,041 transitions in the same period last year.
This represents 79% of the total transactions, while it was 66% during Q3 2022, showing a huge YoY increase of 184% in terms of volume and a 367% rise in value.
- In Q3 2023, 87% was the off-plan sales transaction share in the total sales transitions value, while 64% was its share during the same period last year.
It reached AED 12,713 billion in Q3 2023, compared to AED 2.72 billion during Q3 2022.
- The off-plan market witnessed an 184% increase compared to Q2 2023.
Existing/Ready Sales Transactions
- In Q3 2023, the existing/ready market recorded 764 ready properties, compared to 528 in the same period last year.
This represents about 21% of the total transactions, compared to 34% in Q3 2022, showing a significant rise of 45% in comparison to the same time last year.
- In terms of value, the existing/ready market’s share of the total sales transitions value was 13% in Q3 2023, while it was 36% in Q3 2022.
It reached AED 1,873 billion, showing a significant rise of 25%, as it was AED 1,502 billion during Q3 2022.

High-in-Demand Areas for Sale and Rent
| Apartments for Sale | Villas for Sale | Apartments for Rent | Villas for Rent |
| Al Reem Island | Yas Island | Al Reem Island | Khalifa City |
| Yas Island | Saadiyat Island | Al Raha Beach | Mohamed Bin Zayed City |
| Al Raha Beach | Al Reef | Khalifa City | Yas Island |
| Saadiyat Island | Khalifa City | Corniche Road | Al Reef |
| Masdar City | Al Reem Island | Al Khalidiya | Saadiyat Island |
Property Sales Prices in Abu Dhabi
The table below shows the average asking prices for apartments in Abu Dhabi in Q3 2023:
| Three Bedrooms | Two Bedrooms | One Bedroom | Area |
| AED 2,050,000 | AED 1,400,000 | AED 909,000 | Al Reem Island |
| AED 1,960,000 | AED 1,815,000 | AED 1,000,000 | Yas Island |
| AED 2,500,000 | AED 1,750,000 | AED 1,200,000 | Al Raha Beach |
| AED 7,619,000 | AED 4,792,000 | AED 2,283,000 | Saadiyat Island |
| AED 1,471,000 | AED 1,100,000 | AED 754,000 | Masdar City |
The table below shows the average asking prices for villas in Abu Dhabi in Q3 2023:
| Five Bedrooms | Four Bedrooms | Three Bedrooms | Area |
| AED 6,800,000 | AED 5,984,700 | AED 4,500,000 | Yas Island |
| AED 12,867,000 | AED 9,021,000 | AED 6,600,000 | Saadiyat Island |
| AED 2,500,000 | AED 2,239,000 | AED 1,601,000 | Al Reef |
| AED 5,300,000 | AED 4,096,000 | AED 2,940,000 | Khalifa City |
| NA | AED 3,494,000 | AED 3,430,000 | Al Reem Island |
Property Rental Prices in Abu Dhabi
The table below shows the average rental prices for apartments in Abu Dhabi in Q3 2023.
| Three Bedrooms | Two Bedrooms | One Bedroom | Area |
| AED 130,000 | AED 90,000 | AED 60,000 | Al Reem Island |
| AED 150,000 | AED 109,000 | AED 60,000 | Al Raha Beach |
| AED 86,000 | AED 63,000 | AED 44,000 | Khalifa City |
| AED 150,000 | AED 115,000 | AED 85,000 | Corniche Road |
| AED 100,000 | AED 75,000 | AED 60,000 | Al Khalidiya |
The table below shows the average rental prices for villas in Abu Dhabi in Q3 2023:
| Five Bedrooms | Four Bedrooms | Three Bedroom | Area |
| AED 170,000 | AED 160,000 | AED 140,000 | Khalifa City |
| AED 150,000 | AED 130,000 | AED 117,500 | Mohamed Bin Zayed City |
| AED 330,000 | AED 340,000 | AED 250,000 | Yas Island |
| AED 157,500 | AED 140,000 | AED 105,000 | Al Reef |
| AED 600,000 | AED 430,000 | AED 300,000 | Saadiyat Island |
Dubai
Highlights
- According to the Dubai Statistics Center’s data, the real estate sector in Dubai had a share of 14.1% of the city’s GDP in 2022.
- With such an increase, the sector records a notable rise of 3.1% compared to the previous year.
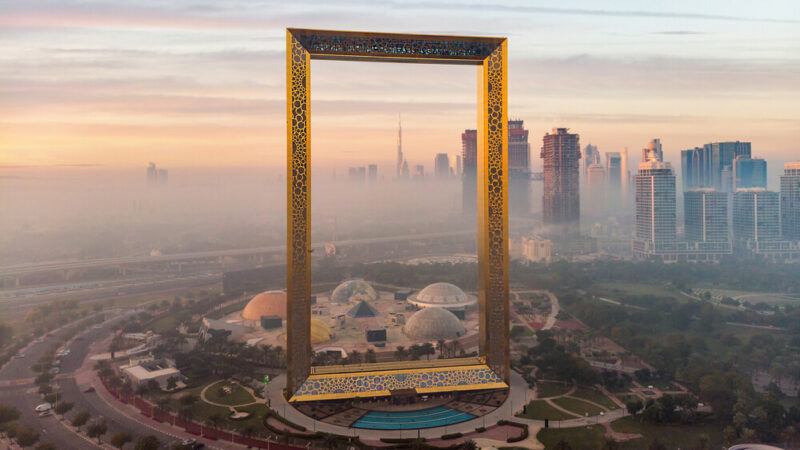
Volume
Total Sales Transactions
- Q3 2023 shows a remarkable record for a quarter over the last decade.
- The registered sales reached 36,567 transactions in Q3 2023, while during the same period last year, it was 25,381.
This reflects a recognizable increase of 44.07% YoY, recording the highest performance for a quarter over the last decade.
- The existing/ready transactions in Q3 2023 represented 45.01% of the total sales transactions, compared to 53.56% in Q3 2022.
- For off-plan transactions, it contributed to 54.9% of total sales transactions, while in Q3 2022, it was 46.44%.
Off-plan Sales Transactions
- The off-plan sales showed a great record by amounting to 20,110 transactions in Q3 2023, while in Q3 2022, it was 11,788, achieving around 70.6% increase.
- In contribution to total sales transactions, the off-plan transactions share was 55%, recording the highest sales transactions volume for Q3 in a decade.
Existing/Ready Sales Transactions
- In Q3 2023, the existing sales reached a new record by achieving 16,457 transactions, compared to 13,593 in Q3 2022, making it the highest performance recorded for a quarter ever.
- The ready/existing transactions record a YoY increase of 21.07%, compared to the same period last year, and 7.22% compared to the existing transactions in Q2 2023.
- During Q3 2023, the contribution of the existing transactions to the total transactions is 45%.

Value
Total Sales Transactions
- In Q3 of 2023, sales transactions hit an all-time quarterly high, reaching AED 109.27 billion, compared to AED 69.32 billion in the same period in 2022.
- The market value of the sales transactions rose by 57.6% compared to Q3 2022, reaching a new increase in the total sales value.
This owes to the strong economic growth and the tourism industry, which led to a stable demand for housing despite the instability of the global economy.
Off-plan Sales Transactions
- The value of the off-plan sales recorded a significant value with an amount of AED 47.50 billion transaction in Q3 2023, compared to Q3 2022 with a value of AED 24.30 billion.
This shows an increase of about 95.45%.
- The off-plan sales contribution was 43% of the total sales transactions value, showing the highest value record for Q3 ever.
Existing/Ready Sales Transactions
- The Existing/Ready sales value hit a new high record of AED 61.8 billion, in comparison to AED 45.03 billion in Q3 2022.
- This shows a notable increase of 37.3% which is the highest transaction value ever for a quarter, achieving an 11.2% increase from Q2 2023.
Total Rental Contracts Q3 2023
- The rental market in Dubai is considered a stable one in relation to the international markets.
- The rental contracts in Q3 2023 have shown a YoY increase of 11.2%. This is through registering 156,422 contracts compared to 140,685 in Q3 2022.
- It was also noticed that the tenant’s behavior has changed as they preferred to buy a home instead of renting, which owes to the increase in the average market value for renting.
- About 54.2% of the total rental contracts were new contracts and 45.8% were renewals, according to DLD’s data for Q3 2023.
- During Q3 2023, 69.74% of the total contracts were residential and 29.22% were commercial contracts and others
Here are the top 10 areas in terms of contracts volume
- Jabal Ali Industrial First
- Al Warsan First
- Jabal Ali First
- Al Mararr
- Business Bay
- Marsa Dubai
- Al Barsha South Fourth
- Al Goze Industrial Second
- Muhaisanah Second
- Naif.

New Rental Contracts Volume Q3 2023
- The number of new contracts in Q3 2023 is 84,766, reflecting a rise of 2.63% compared to 82,596 contracts in Q3 2022.
- According to the quarter-on-quarter analysis, Q3 2023 witnessed a recognizable rise of 20.97%, as the number of registered contracts in Q2 2023 was 70,074.
Find below the top areas that showed a notable rise in the volume of new contracts.
- Hor Al Anz
- Al Mararr
- Al Goze Third.
Renewed Contracts Volume Q3 2023
- In Q3 2023, the renewed contracts supported the rental market by registering 71,656 contracts, while in Q3 2022, 58,089 contracts were registered; this shows an increase of 23.36% for Q3 2023.
- According to the quarter-on-quarter analysis, Q3 2023 witnessed a recognisable rise of 17% compared to 61,219 registered contracts in Q2 2023.
Here are the top areas that witnessed a notable increase in the renewed contract volume
- Al Barsha South Fourth
- Al Goze Industrial Second
- Al Karama
High-in-Demand Areas for Sale and Rent
The following table includes the top options for owning or renting an apartment or villa in Dubai.
| Apartments for Sale | Villas for Sale | Apartments for Rent | Villas for Rent |
| Dubai Marina | Dubai Hills Estate | Dubai Marina | Dubai Hills Estate |
| Downtown Dubai | Palm Jumeirah | Jumeirah Village Circle (JVC) | Damac Hills 2 |
| Jumeirah Village Circle | Arabian Ranches | Business Bay | Al Barsha |
| Business Bay | Al Fujran | Downtown Dubai | Jumeirah |
| Palm Jumeirah | Damac Hills | Jumeirah Lake Towers (JLT) | Damac Hills |
Property Sales Prices in Dubai
The table below shows the average asking prices for apartments in Dubai in Q3 2023:
| Three Bedrooms | Two Bedrooms | One Bedroom | Area |
| AED 3,900,000 | AED 2,500,000 | AED 1,545,000 | Dubai Marina |
| AED 6,871,000 | AED 3,600,000 | AED 1,950,000 | Downtown Dubai |
| AED 2,150,000 | AED 1,450,000 | AED 850,000 | Jumeirah Village Circle |
| AED 4,000,000 | AED 2,650,000 | AED 1,765,000 | Business Bay |
| AED 7,500,000 | AED 5,200,000 | AED 3,430,000 | Palm Jumeirah |
The table below shows the average asking prices for villas in Dubai in Q3 2023:
| Area | Three Bedrooms | Four Bedrooms | Five Bedrooms |
| Dubai Hills Estate | AED 5,847,600 | AED 5,000,000 | AED 13,062,000 |
| Palm Jumeirah | AED 11,250,000 | AED 36,072,000 | AED 38,000,000 |
| Arabian Ranches | AED 3,895,000 | AED 6,500,000 | AED 9,400,000 |
| Al Fujran | AED 3,000,000 | AED 3,300,000 | AED 5,500,000 |
| Damac Hills | AED 2,950,000 | AED 4,500,000 | AED 8,166,000 |
Property Rental Prices in Dubai
The table below shows the average rental prices for apartments in Dubai in Q3 2023:
| Area | One Bedroom | Two Bedrooms | Three Bedrooms |
| Dubai Marina | AED 105,000 | AED 165,000 | AED 275,000 |
| Jumeirah Village Circle (JVC) | AED 65,000 | AED 95,000 | AED 160,000 |
| Business Bay | AED 130,000 | AED 150,000 | AED 220,000 |
| Downtown Dubai | AED 90,000 | AED 220,000 | AED 350,000 |
| Jumeirah Lake Towers (JLT) | AED 80,000 | AED 115,000 | AED 160,000 |
The table below shows the average rental prices for villas in Dubai in Q3 2023:
| Area | Three Bedrooms | Four Bedrooms | Five Bedrooms |
| Dubai Hills Estate | AED 330,000 | AED 280,000 | AED 415,000 |
| Damac Hills 2 | AED 90,000 | AED 110,000 | AED 140,000 |
| Al Barsha | AED 375,000 | AED 375,000 | AED 400,000 |
| Jumeirah | AED 230,000 | AED 380,000 | AED 350,000 |
| DAMAC Hills | AED 210,000 | AED 370,000 | AED 400,000 |
Mo’asher
Sales Price Index
- During Q3 2023, the overall quarterly Index for sales reached 1.558 while the Index price was AED 1,432,776.
- The quarterly sales Index recorded
- 1.679 for apartments
- 1.446 for villas/townhouses
- For the quarterly Index price, it reached
- AED 1,393,949 for apartments
- AED 2,477,541 for villas/townhouses
Accordingly, the Index showed growth across all categories. Considering from Q3 2022 to Q3 2023, YoY for the overall Index rose from 1.383 to 1.558, showing an increase of 12.65%.
- The growth rate had varying ranges according to the type of units, which is as follows.
- The apartments had the most significant YoY growth, rising from 1.444 to 1.679.
- Villas increased from 1.276 to 1.446
Overall, Q3 2023 continues its positive performance in the real estate market; this is proven by the yearly and quarterly analyses, which show sustained demand and robust performance, especially within the apartment sector.

Rental Performance Index
- During Q3 2023, the Rental Performance Index significantly rose in all categories. The overall rental Index reached 1.08, which shows a notable improvement in the leasing environment when compared to the previous quarters.
- The overall quarterly Index in Q3 2023 reached 1.08 and AED 58,036 for the Index price.
- The quarterly rental Index recorded
- 1.104 for apartments
- 0.969 for villas/townhouses
- The quarterly rental price reached:
- AED 53,005 for apartments
- AED 150,181 for villas/townhouses
- The apartments segment witnessed a rise with a quarterly rental Index of 1.104, reflecting the high demand or a possibility of a decrease in the available units in the market.
- However, the villas segment is slightly behind the apartments; its quarterly rental Index of 0.969 shows a positive increase.
That’s a wrap however, if you want to delve into more insights and information, you can download the full UAE Market Watch report for Q3 2023.


