Avg. price
2,591,426
3.6%vs. last period
Sourced from
Avg. price
2,591,426
3.6%vs. last period
Avg. price/sqft
1,894
3%vs. last period
Avg. rental yield
5.69%
Transactions
159,922
19.9%vs. last period
Showing 10 transactions of 159,922
| Location | Completion Status | Built-up area (ft²) | Specifications | ||||
|---|---|---|---|---|---|---|---|
| 10 Nov ’26 | Valencia Tower CDamac Lagoons > Lagoon Views > Valencia | 657,720Bulk transaction | 1,639 | Off-plan | 401 | - | StudioApartment |
| 10 Nov ’26 | Valencia Tower CDamac Lagoons > Lagoon Views > Valencia | 657,720Bulk transaction | 1,639 | Off-plan | 401 | - | StudioApartment |
| 10 Nov ’26 | Valencia Tower CDamac Lagoons > Lagoon Views > Valencia | 657,720Bulk transaction | 1,639 | Off-plan | 401 | - | StudioApartment |
| 10 Nov ’26 | MeydanMeydan | 5,041,000Bulk transaction | 1,735 | Off-plan | 2,906 | 4,062 | 3 BedsVilla |
| 10 Nov ’26 | MeydanMeydan | 5,041,000Bulk transaction | 1,735 | Off-plan | 2,906 | 4,062 | 3 BedsVilla |
| 10 Nov ’26 | MeydanMeydan | 5,041,000Bulk transaction | 1,735 | Off-plan | 2,906 | 4,062 | 3 BedsVilla |
| 10 Nov ’26 | Fior 1Mina Rashid | 2,230,888 | 2,936 | Off-plan | 760 | - | 1 BedApartment |
| 10 Nov ’26 | Verdania 4Dubai Land Residence Complex | 1,169,025 | 1,490 | Off-plan | 784 | - | 1 BedApartment |
| 10 Nov ’26 | Violet 4Damac Hills 2 > Violet | 2,298,900 | 1,818 | Off-plan | 1,265 | 2,345 | 4 BedsVilla |
| 10 Nov ’26 | Arthouse Private ResidencesMohammed Bin Rashid City > District 11 | 1,162,888 | 1,931 | Off-plan | 602 | - | 1 BedApartment |
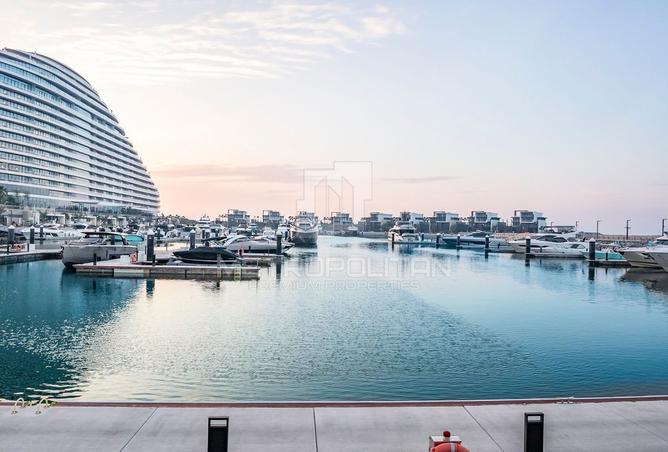
Apartment
Marsa Al Arab, Jumeirah 3, Jumeirah, Dubai
2
3
2,009 sqft
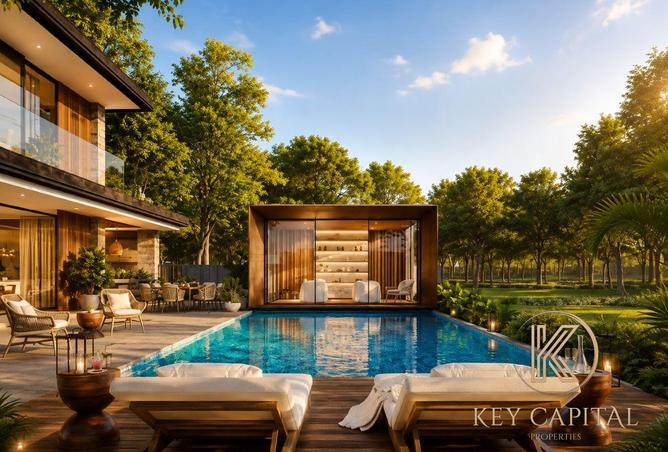
Villa
Alaya Gardens, Tilal Al Ghaf, Dubai
5
7
6,918 sqft
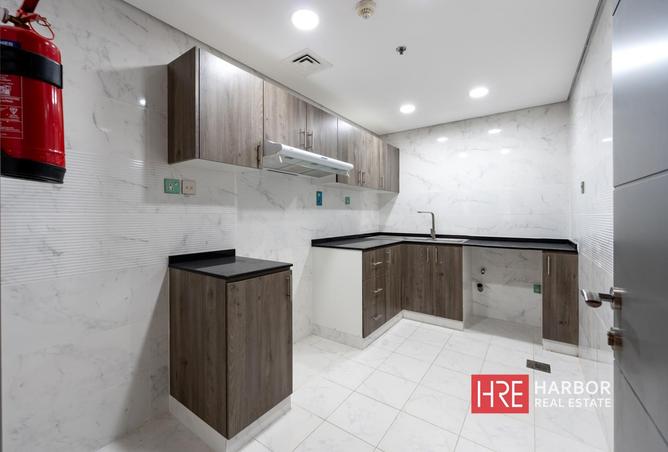
Apartment
National Bonds Plaza, Barsha Heights (Tecom), Dubai
1
1
730 sqft
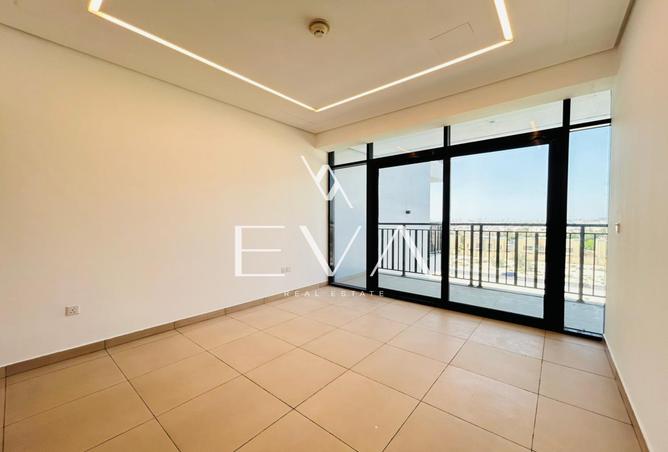
Apartment
Sunrise Legend, Arjan, Dubai
1
2
809 sqft
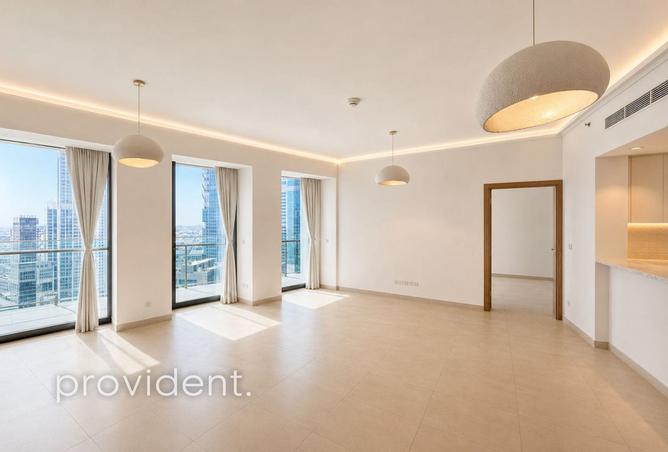
Apartment
Burj Vista Tower 1, Burj Vista, Downtown Dubai, Dubai
2
3
1,469 sqft
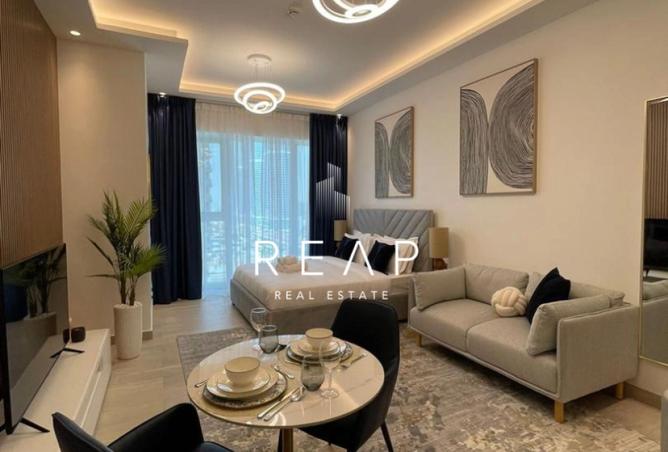
Apartment
Me Do Re Tower, JLT Cluster L, Jumeirah Lake Towers, Dubai
studio
1
429 sqft
Dubai recorded 159,922 real estate transactions over the past 12 months, down by 19.9%, worth AED 413.2 billion in total. The table shows every sale, drawn from prices registered with the Dubai Land Department rather than sellers' asking prices.
A surge in new supply is expected to stabilize Dubai property prices in 2027, as developers have more than 160,000 homes scheduled for completion that year. Handover forecasts vary, with several estimating 60,000 to 70,000 units, well above the city’s five-year average of around 35,500 a year.
Jumeirah Village Circle (JVC), Business Bay, and Azizi Venice will have some of the highest supplies. Around 66% of the homes due in 2027 had already been sold off-plan. The prices of Dubai properties for sale will depend on whether those owners move in, rent out, or resell, and whether enough new residents arrive to take up the homes.
Tracking DLD transactions in the area you’re considering gives you a clearer picture of the type of home and budget you have in mind.
Where you buy has a big effect on property prices in Dubai. Based on DLD transactions over the past 12 months, homes in Emirates Hills averaged AED 71,070,000, followed by Al Manara at AED 24,390,000. Al Qusais, International City, and Dubai Industrial City had the lowest averages, at AED 645,300, AED 671,000, and AED 794,400. Filter the table by community to compare an asking price with recent sales nearby.
Certain locations lead the pack in terms of sales volume. Dubai South (Dubai World Central) recorded the highest number of real estate transactions in Dubai over the past 12 months with 14,747 sales, followed by Jumeirah Village Circle (10,951) and Dubai Land Residence Complex (6,241). In an area with a high transaction volume such as Dubai South (Dubai World Central), you can easily find several recent prices to compare an asking price against. In a location with only a handful of sales over the past 12 months, you may struggle to compare property prices.