
Having an updated overview of the UAE real estate market’s status is surely something important; it allows you to take decisions regarding renting, buying, or investing based on data and insights.
Through this quick and inclusive guide, you will know all about the market’s performance and trends during Q2 2023.
Highlights
Find below the highlights of the market during the second quarter of 2023.
- The market witnessed a significant increase in transactions which shows the investors’ confidence, owing to the government’s ongoing efforts to enhance regulatory frameworks and investment environments.
- The off-plan market continues to support real estate growth across both emirates: Abu Dhabi and Dubai, with significant increases in sales transactions and value expected to sustain in the coming months.
Abu Dhabi
Highlights
- The solid investor confidence in addition to notable uptake of new projects and the introduction of innovative developments in Abu Dhabi led to an increase in the sales transaction year-on-year in Q2 2023.
This was a result of 1,838 off-plan transactions during this quarter, as compared to 947 transactions in Q2 2022.
- Consequently, this number represents 71.4% of the total transactions, compared to 60.7% in Q2 2022.
- During Q2 2023, the market also showed a significant YoY increase of 94.1% in terms of volume and a 118% increase in value.
Total Sales Transactions
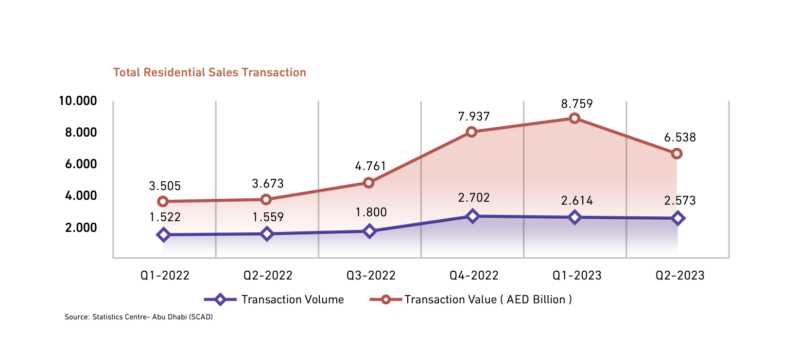
- The total sales transactions (Residential and Commercial) in Abu Dhabi increased by 57.7% in Q2 2023, as transactions during this quarter reached 2,635, while in Q1 of 2022, it was 1,671.
- The share of the residential transactions was 97.6% of the total volume and about 89% of the total value.
- In terms of volume: the residential transactions reached 2,573 during Q2 2023, which shows a significant YoY increase of 65%, compared to 1,559 during the same quarter last year.
- In terms of value: it amounted to AED 6.5 billion, compared to AED 3.7 billion last year during the same period, achieving an increase of 78%.
Off-plan Sales Transactions
- In Q2 2023, the off-plan market continued its support of Abu Dhabi’s real estate market. It witnessed 1,838 off-plan sales transactions in Q2 2023, while in Q2 2022, it had only 947 transactions.
This represents 71.4% of the total transactions; on the other hand, Q2 2022’s total sales transactions were 60.7%, which reflects an astonishing increase.
- This shows a significant YoY increase of 94.1% when it comes to volume and 118% in terms of value compared to Q2 2022.
- The value of the off-plan sales transactions amounted to AED 4.704 billion, compared to AED 2.157 billion in Q2 2022.
- The market also witnessed a decrease of 4.3% in the off-plan transaction value in Q2 2023 compared to Q1 2023.
Existing/Ready Sales Transactions
- In Q2 2023, the existing/ready market witnessed the registration of 735 ready properties, while in Q2 2022, it amounted to 612.
- The number of registered properties in Q2 2023, represents about 28.6% of the total transactions; relating to Q2 2022, the percentage back then was 39.3%.
- In Q2 2023, the existing/ready sales transactions value has a share of 28.1% of the total sales transactions value.
- The existing/ready transactions value reached AED 1.834 billion in Q2 2023, while in Q2 2022, it amounted to AED 1.517 billion, reflecting a notable rise of 20.9%.
High-in-Demand Areas for Sale and Rent
| Apartments for Sale | Villas for Sale | Apartments for Rent | Villas for Rent |
| Al Reem Island | Yas Island | Al Reem Island | Khalifa City |
| Yas Island | Saadiyat Island | Al Raha Beach | Mohamed Bin Zayed City |
| Al Raha Beach | Al Reef | Khalifa City | Yas Island |
| Saadiyat Island | Al Reem Island | Corniche Road | Al Reef |
| Masdar City | Khalifa City | Al Khalidiya | Saadiyat Island |
Property Sales Prices in Abu Dhabi
The table below shows the average asking prices for apartments in Abu Dhabi in Q2 2023:
| Area | One Bedroom | Two Bedrooms | Three Bedrooms |
| Al Reem Island | AED 830,000 | AED 1,400,000 | AED 2,000,000 |
| Yas Island | AED 950,000 | AED 1,700,000 | AED 1,850,000 |
| Al Raha Beach | AED 1,188,000 | AED 1,725,000 | AED 2,500,000 |
| Saadiyat Island | AED 2,094,000 | AED 4,380,000 | AED 7,800,000 |
| Masdar City | AED 750,000 | AED 1,072,000 | AED 1,180,000 |
The table below shows the average asking prices for villas in Abu Dhabi in Q2 2023:
| Area | Three Bedroom | Four Bedrooms | Five Bedrooms |
| Yas Island | AED 4,400,000 | AED 5,734,000 | AED 6,250,000 |
| Saadiyat Island | AED 7,000,000 | AED 8,721,000 | AED 11,900,400 |
| Al Reef | AED 1,600,000 | AED 2,213,000 | AED 2,568,000 |
| Al Reem Island | AED 3,150,000 | AED 3,322,000 | N/A |
| Khalifa City | AED 2,565,000 | AED 3,837,000 | AED 5,620,000 |
Property Rental Prices in Abu Dhabi
The table below shows the average rental prices for apartments in Abu Dhabi in Q2 2023 at the top preferences either for homeownership or investment in Abu Dhabi.
| Area | One Bedroom | Two Bedrooms | Three Bedrooms |
| Al Reem Island | AED 60,000 | AED 94,000 | AED 120,000 |
| Al Raha Beach | AED 65,000 | AED 109,000 | AED 161,000 |
| Khalifa City | AED 42,000 | AED 62,000 | AED 86,000 |
| Corniche Road | AED 80,000 | AED 115,000 | AED 155,000 |
| Al Khalidiya | AED 55,000 | AED 75,000 | AED 100,000 |
The table below shows the average rental prices for villas in Abu Dhabi in Q2 2023:
| Area | Three Bedroom | Four Bedrooms | Five Bedrooms |
| Khalifa City | AED 130,000 | AED 155,000 | AED 170,000 |
| Mohamed Bin Zayed City | AED 105,000 | AED 130,000 | AED 150,000 |
| Yas Island | AED 240,000 | AED 300,000 | AED 320,000 |
| Al Reef | AED 100,000 | AED 140,000 | AED 153,000 |
| Saadiyat Island | AED 325,000 | AED 449,000 | AED 600,000 |
Dubai
Highlights
- The real estate market in Dubai during Q2 2023 achieved an exceptional record for the quarter over the last decade.
Volume
Total Sales Transactions
- In Q2 2023, the registered sales amounted to 30,098 transactions, compared to 22,322 transactions during Q2 2022, showing a huge YoY increase of 34.84%.
- With such an increase, it records the second-highest performance for a quarter over the last decade, compared to Q1 2023, owing to the outstanding performance of the ready transactions
- The existing/ready transactions: it represents 51.12% of the total sales transactions, compared to 60% in Q2 2022.
- Off-plan: it had powerful support for the market regarding the transactions volume. During Q2 2023, the off-plan percent represented 48.88% of the total transactions while in Q2 2022, it was 40%, driving the market into a significant record for a quarter.
Off-plan Sales Transactions
- The off-plan sales reached 14,712 transactions in Q2 2023 compared to 8,929 in Q2 2022, achieving a notable rise of 65%.
- During Q2 2023, the off-plan transactions represented 48.9% of the total transactions, which is almost a 9% increase compared to 40% during the same period last year.
Existing/Ready Sales Transactions
- The existing sales reached a new record with 15,386 transactions in Q2 2023, compared to 13,393 in Q2 2022, making it the highest performance of the quarter ever.
- The ready/existing transactions show a YoY increase of 14.88% compared to Q2 2022 and a 2.5% rise compared to Q1 2023.

Value
Total Sales Transactions
- In Q2 2023, the market’s value of sales transactions reached AED 90.75 billion, compared to AED 58.96 billion in Q2 2022, recording the highest value ever for a quarter.
- The value of sales transactions shows an increase of 53.93%, compared to Q2 2022, showing an exceptional increase in the total sales value.
- This owes to the strong economic growth and tourism, which led to the steady demand for housing, although the unstable state of the global economy.
Off-plan Sales Transactions
- During Q2 2023, the off-plan sales reached AED 35,06 billion in transactions, compared to AED 18,34 billion in Q2 2022, showing an increase of 91.18%.
- The off-plan transactions represent 38.64% of the total transactions’ value, showing about a 7.5% increase compared to the same period last year, which was 31.1% of the total transaction value.
Existing/Ready Sales Transactions
- During Q2 2023, the existing/ready sales value hit a new record reaching AED 55.7 billion, compared to AED 40.6 billion in Q2 2022, showing an exceptional increase of 37.11%.
- In addition, this record is the highest transaction value ever for a quarter with a 4.2% increase from the previous quarter (Q1 2023).

Total Rental Contracts Q2 2023
New Rental Contracts Volume Q2 2023
The Dubai rental market experienced the signing of numerous new rental agreements by residents in search of new homes. Below are the top areas where these new leasing contracts were executed:
- Jabal Ali Industrial First
- Muhaisanah Second
- Hor Al Anz
- Al Goze Industrial Second
- Al Goze Third
- Al Warsan First.
Renewed Contracts Volume Q2 2023
The renewed contracts show the ongoing demand and satisfaction of the residents towards these communities.
Here are the top areas that witnessed contract renewals in Dubai, in order from the highest.
- Jabal Ali First
- Al Warsan First
- Al Goze Industrial Second
- Al Karama
- Nadd Hessa
- Naif
- Jabal Ali Industrial First

High-in-Demand Areas for Sale and Rent
The following table includes the top options for owning or renting an apartment or villa in Dubai.
| Apartments for Sale | Villas for Sale | Apartments for Rent | Villas for Rent |
| Dubai Marina | Dubai Hills Estate | Dubai Marina | Dubai Hills Estate |
| Downtown Dubai | Palm Jumeirah | Jumeirah Village Circle | DAMAC Hills 2 |
| Business Bay | Arabian Ranches | Downtown Dubai | Al Barsha |
| Jumeirah Village Circle | DAMAC Hills | Business Bay | Jumeirah |
| Palm Jumeirah | Al Fujran | Jumeirah Lake Towers | DAMAC Hills |
Property Sales Prices in Dubai
The table below shows the average asking prices for apartments in Dubai in Q2 2023:
| Area | One Bedroom | Two Bedrooms | Three Bedrooms |
| Dubai Marina | AED 1,400,000 | AED 2,350,000 | AED 3,700,000 |
| Downtown Dubai | AED 1,900,000 | AED 4,000,000 | AED 5,900,000 |
| Business Bay | AED 1,550,000 | AED 2,499,000 | AED 3,800,000 |
| Jumeirah Village Circle | AED 850,000 | AED 1,500,000 | AED 1,960,000 |
| Palm Jumeirah | AED 3,000,000 | AED 5,250,000 | AED 7,400,000 |
The table below shows the average asking prices for villas in Dubai in Q2 2023:
| Area | Three Bedrooms | Four Bedrooms | Five Bedrooms |
| Dubai Hills Estate | AED 5,500,000 | AED 4,600,000 | AED 9,100,000 |
| Palm Jumeirah | AED 10,562,500 | AED 32,000,000 | AED 40,000,000 |
| Arabian Ranches | AED 3,600,000 | AED 6,500,000 | AED 8,500,000 |
| DAMAC Hills | AED 2,800,000 | AED 3,600,000 | AED 6,900,000 |
| Al Fujran | AED 2,750,000 | AED 3,450,000 | AED 5,200,000 |
Property Rental Prices in Dubai
The table below shows the average rental prices for apartments in Dubai in Q2 2023:
| Area | One Bedroom | Two Bedrooms | Three Bedrooms |
| Dubai Marina | AED 105,000 | AED 155,000 | AED 240,000 |
| Jumeirah Village Circle | AED 65,000 | AED 90,000 | AED 130,000 |
| Downtown Dubai | AED 130,000 | AED 220,000 | AED 370,000 |
| Business Bay | AED 90,000 | AED 145,000 | AED 210,000 |
| Jumeirah Lake Towers | AED 80,000 | AED 120,000 | AED 150,000 |
The table below shows the average rental prices for villas in Dubai in Q2 2023:
| Area | Three Bedrooms | Four Bedrooms | Five Bedrooms |
| Dubai Hills Estate | AED 310,000 | AED 280,000 | AED 350,000 |
| DAMAC Hills 2 | AED 79,500 | AED 325,000 | AED 130,000 |
| Al Barsha | AED 300,000 | AED 325,000 | AED 400,000 |
| Jumeirah | AED 250,000 | AED 350,000 | AED 450,000 |
| DAMAC Hills | AED 229,999 | AED 320,000 | AED 440,000 |
Property Finder is always trying to give you full visibility to make a data-driven decision. For extra details, you can download the full Market Watch Report for Q2 2023.


